For equipment dealers and industrial suppliers, managing spare parts inventory is a delicate balancing act. Stock too few parts, and you face costly downtime, delayed repairs, and dissatisfied customers. Stock too many, and valuable capital is trapped in slow-moving inventory, elevating carrying costs and the risk of obsolescence.
While standard Sales and Operations Planning (S&OP) frameworks work well for high-volume, finished-goods manufacturing, spare parts present a distinct set of challenges. Demand is often intermittent, lead times vary widely, and customer urgency is parameter number one.
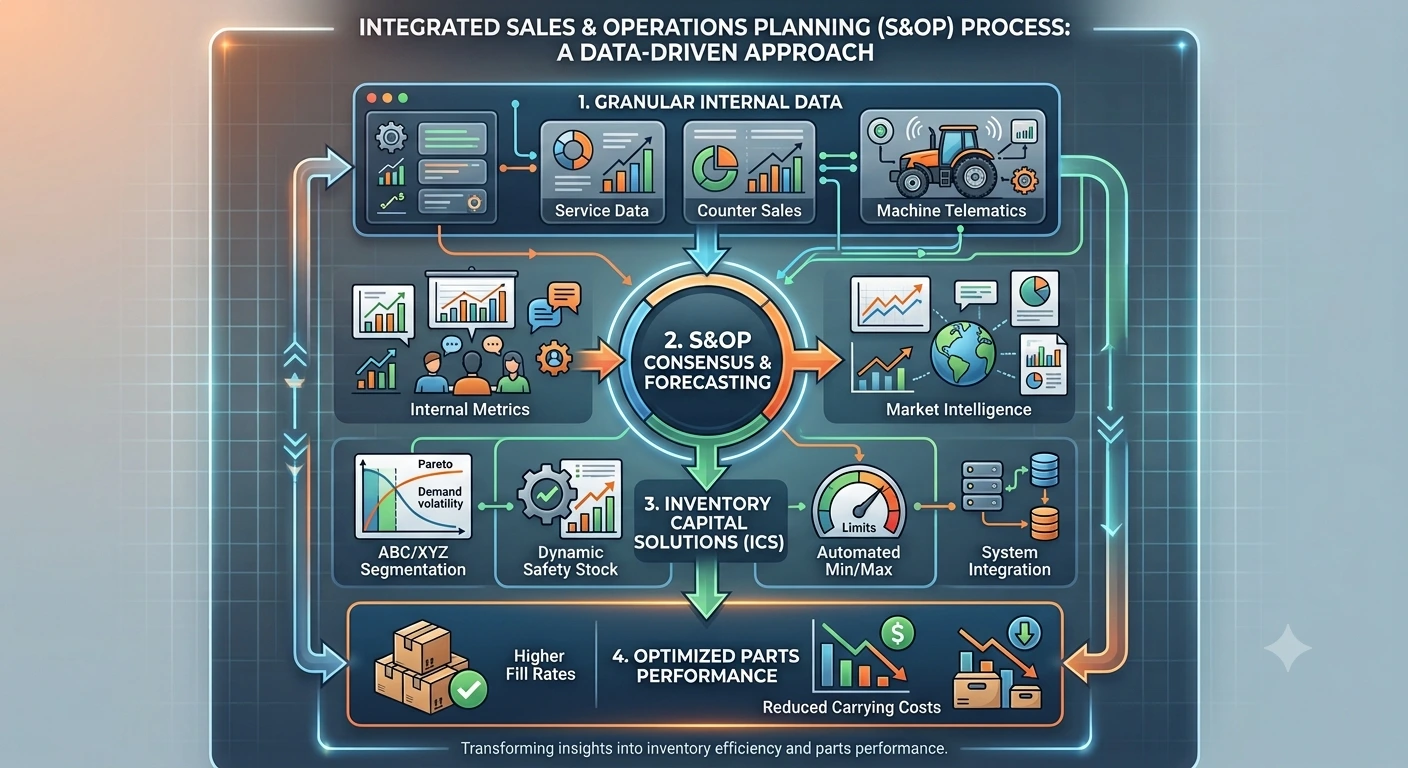
To achieve peak inventory performance, organizations must adapt classic S&OP strategies specifically for parts operations. By harmonizing internal operational data, actionable market intelligence, and the advanced forecasting methodology offered by Inventory Capital Solutions (ICS) from FDC, supply chain leaders can transform parts inventory management from a reactive scramble into a proactive growth driver.
Grounding Your Strategy in Granular Data
Traditional reorder formulas rely on basic historical averages, but spare parts demand rarely follows a predictable, linear path. A robust S&OP process begins by looking deeper into your internal data ecosystem.
Here is a summary of the key data sources you should plan to include in your planning process.
Consumption vs. Demand. Distinguish between actual customer demand and past sales. If a part was out of stock, zero sales were recorded, but the underlying demand still existed.
Service vs. Counter Trends. Track demand streams separately. Service shop demand often behaves differently from over-the-counter retail transactions.
Equipment Population and Utilization. Monitor regional machine counts, work hours, and telematics data to anticipate routine maintenance intervals before failure occurs.
Supplier Lead-Time Variability. Incorporate actual, real-world lead times from original equipment manufacturers (OEMs) and aftermarket vendors rather than relying on static purchase order defaults.
By breaking down data silos between service shops, customer retail orders, and field technicians, inventory teams gain a unified view of what parts are truly needed and when.
Layering Market Intelligence onto Predictive Models
Historical data shows where you’ve been, but market intelligence reveals where you are going. Integrating external market indicators into your S&OP rhythm prevents major forecasting blind spots caused by shifting economic conditions or industry trends.
Here is a list of high-value intelligence that becomes important inputs to your process.
Regional Project Activity. Upcoming infrastructure initiatives, mining developments, or commercial construction starts directly correlate with machine wear and maintenance needs.
Seasonal and Fleet Cycles. Weather events, harvest seasons, and fleet renewal patterns drive cyclical spikes in specific component categories.
OEM Campaigns and Bulletins. Factory recalls, recommended modification kits, and promotional pricing programs can drastically impact short-term demand profiles.
Supply Chain Disruption Signals. Tracking port congestions, freight bottlenecks, or raw material shortages allows you to proactively adjust safety stock margins before availability tightens.
Bringing market intelligence into the consensus forecasting meeting enables teams to adjust statistical baselines with real-world context.
Leveraging the Power of ICS for Your S&OP Process
Even the best data and market insights are useless if your team lacks the tools to execute decisions efficiently across thousands—or hundreds of thousands—of active part numbers. This is where Inventory Capital Solutions (ICS) becomes indispensable.
Here is a summary of the the ICS capabilities that are essentional to parts inventory management.
ABC/XYZ Demand Segmentation. Automatically categorize parts not only by monetary value (ABC analysis) but also by demand predictability (XYZ analysis). Fast-moving, critical maintenance items require vastly different stocking logic than intermittent, high-cost components.
Dynamic Stock Leveling. Replace static min/max thresholds with algorithms that continuously recalibrate order points based on demand velocity, lead-time changes, and target service levels.
Automated Order Recommendations. Streamline purchase order creation by surfacing prioritized restocking recommendations directly to parts managers, eliminating manual guesswork.
Seamless System Integration. Connect ICS directly with your Enterprise Resource Planning (ERP) system to ensure real-time inventory visibility across multiple locations.
Operationalizing the S&OP Rhythm for Parts
Implementing a parts-centric S&OP process is an ongoing operational cadence, not a one-time project. Success requires structuring a repeatable monthly sequence.
| S&OP Step | Focus & Action Items | Core Stakeholders |
| 1. Data Gathering | Consolidate inventory levels, fill rates, supplier performance, and sales history. | Data Analysts, Inventory Managers |
| 2. Demand Planning | Review statistical forecasts; apply market intelligence and service job projections. | Parts Managers, Service Supervisors, Sales |
| 3. Supply Alignment | Compare forecasted demand against vendor availability, warehouse capacity, and cash constraints. | Procurement, Logistics, Finance |
| 4. Executive Consensus | Resolve fill rate vs. holding cost trade-offs and sign off on target inventory levels. | Operations Executives, Leadership |
Strategic Metrics to Benchmark Success
To ensure your revised S&OP model delivers tangible business value, track four core Key Performance Indicators (KPIs).
First-Pass Fill Rate. Percentage of parts orders fulfilled immediately from shelf stock without backordering.
Inventory Turnover Ratio. How efficiently carrying capital is converted into revenue throughout the year.
Dead Stock Percentage. Total value tied up in non-moving or obsolete inventory over a 12-to-24-month horizon.
Emergency Order Ratio. Percentage of orders placed on expedite status due to unexpected stockouts.
Streamline Your Parts Inventory with FDC
Achieving peak inventory performance requires the right blend of strategy, process, and specialized technology. At FDC, we empower equipment dealers and industrial distributors to modernize their parts operations, integrate complex systems, and unlock maximum profitability from their inventory assets.
Ready to transform your parts inventory planning?
Contact our team today to start the conversation about how we can help you transform parts inventory management from a reactive scramble into a proactive growth driver.